Estimated reading time: 14 minutes
Table of contents
Whether you are a seasoned project manager or just starting, understanding how to use a Gantt chart effectively can significantly enhance your ability to plan, track, and manage projects.
A Gantt chart visually represents project tasks and their corresponding timelines. It provides an easy-to-understand overview of project progress, dependencies, and milestones. By using this tool effectively, you can streamline your project management processes, improve communication among team members, and ensure timely completion of individual tasks.
We’ll take you step by step through creating a Gantt chart and how to use one. We will also explore various use cases where Gantt charts can be applied across different industries and projects. Whether managing a small business venture or overseeing complex construction projects, the principles behind using a Gantt chart remain the same.
The History of the Gantt Chart
The Gantt chart was invented by American engineer and management consultant Henry Gantt between the 1910s-1915s. Henry Gantt was a great proponent of using scientific management and methods as a whole and was working to integrate these concepts to improve productivity and efficiency.
The Gantt chart was born out of the need to visualize the overall progress of a project — creating a way that someone could quickly see the status and timelines of work being done and also communicate that status to other people.
The first Gantt chart was a simple bar graph showing each task’s start and end dates. Its position on the chart indicated the task’s project status at a given time. As the charts evolved, they began to include more detailed information, such as task dependencies, task duration, and resource allocation.
Gantt charts, now, are widely used in various industries and recognized as an important tool for successful project management and task completion.
Who Uses Gantt Charts?
Gantt charts are widely used across various industries and departments by project managers, business owners, team leaders, and executives. They are an agile project management tool that has been recognized as an important tool for project managers.
What are Gantt Charts?
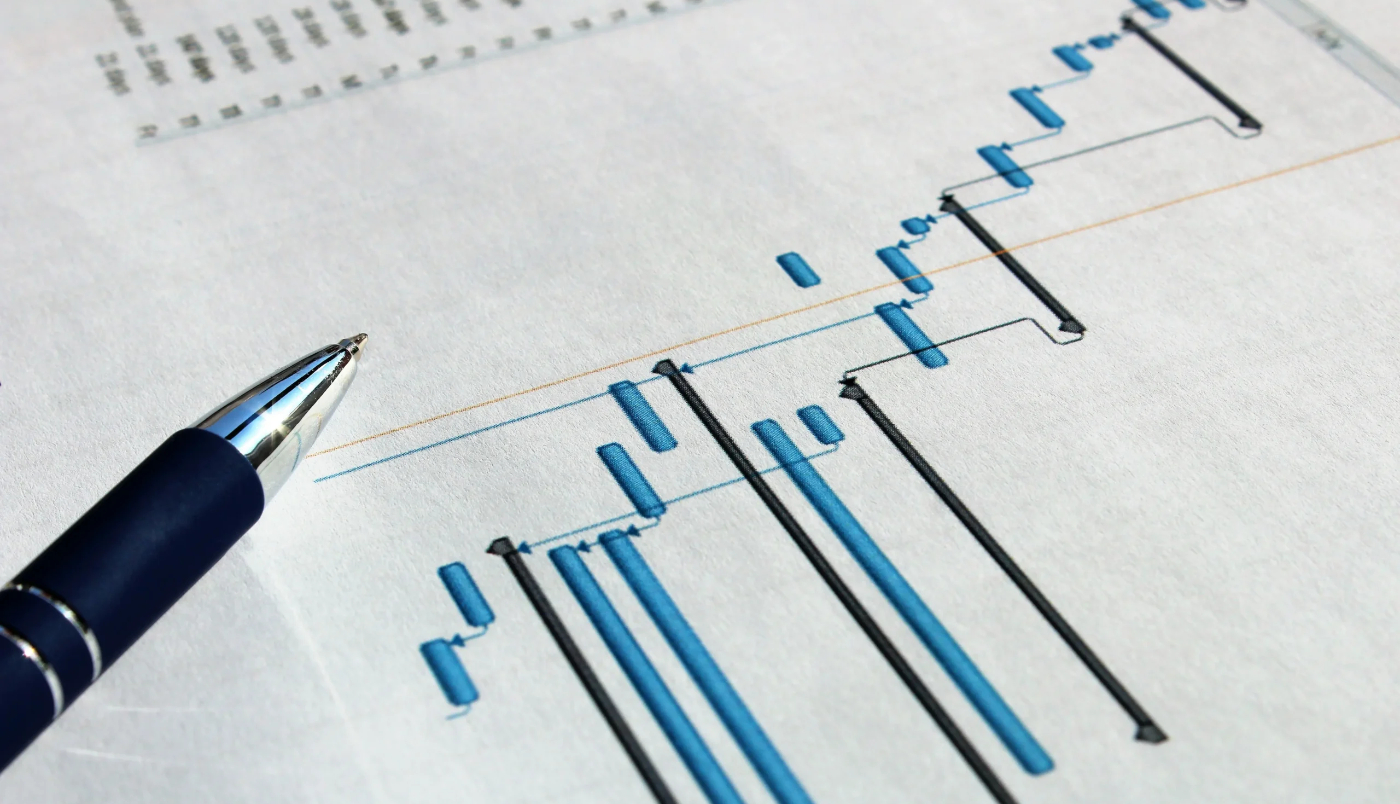
A Gantt chart is a visual representation of a project schedule that illustrates the timing of various tasks and their dependencies. This project management tool displays tasks as horizontal bars along a timeline, with each bar chart representing a specific activity’s start and end dates.
The Gantt chart provides a comprehensive overview of project timelines, helping teams and managers understand the tasks’ sequence and duration. Gantt charts can help project managers and teams plan, monitor, and communicate project schedules, making them a vital tool.
The visual nature of Gantt charts simplifies complex project schedules, allowing stakeholders to grasp project progress, identify potential bottlenecks, and make informed decisions.
How to Create Gantt Charts
To create a Gantt chart, you will need a list of tasks, the task start and end dates, and the dependencies associated with the tasks.
You can manually create and use Gantt charts on paper or whiteboard or even use project management software to create a digital chart. Some popular project management tools with Gantt chart capabilities include open-source project management tools like Leantime and commercial offerings such as Microsoft Project and Asana.
Setting up Your Project’s Gantt Chart
You have the tasks, dates, and dependencies. Now what? Below are some items to consider in order to help make a Gantt chart easier:
Define the Project Scope
Before diving headfirst into your project, take a moment to get organized and map out your journey. Define your goals, determine what you want to achieve (the project scope), goals, objectives, and deliverables, and then break down the work into smaller, bite-sized tasks.
Think of it like prepping for a road trip – you wouldn’t just jump in the car without a map and a plan for pit stops, right?
By estimating how long each task will take and identifying any dependencies between them (which tasks need to be completed before others can begin), you’re creating a clear roadmap for success and ensuring your project stays on track.
Keep in mind the more detailed and documented you are, the more likely everyone on the team understands the project and the easier it is for team members to predict what work will come next.
Gantt Chart Tip: One way to do that is to look backward and map out the steps from the end in order to get back to the beginning.
Create Your Gantt Chart

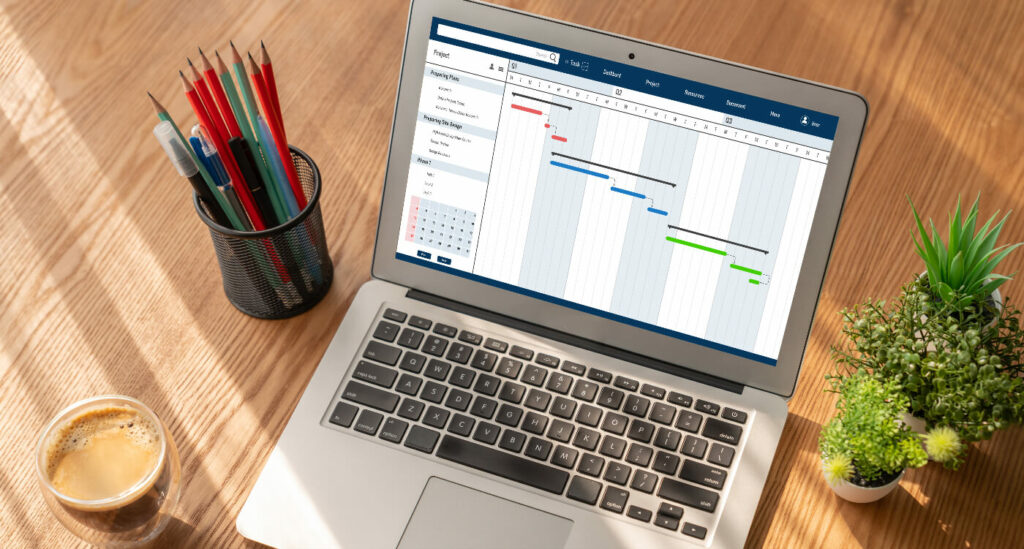
Now that you have successfully defined the project’s scope, it’s time to visualize your plan! Think of a ruler, where each tick mark represents a day, week, or month – that’s your timeline. Each task gets its own horizontal bar chart along this ruler, positioned according to its start and end dates.
The longer the bar, the more time the task takes. To help understand the tasks more efficiently, you can color-code these bars to represent different task types or even specific teams working on them. This visual presentation gives you a clear picture of your project timeline, making tracking progress and identifying potential bottlenecks much easier within the Gantt charts.
Add Task Dependencies
A task dependency is when one task relies on the completion of another task to move forward. You’ll want to identify these as early as possible and call them out on your Gantt chart. These are particularly important because the dependencies could be external or on a different team.
In those situations, these move beyond a task dependency and can become a risk to the project. If the more extensive work is sitting on an external team or provider’s work, you’ll want to be checking in regularly from the beginning.
Gantt Chart Tip: Connect tasks that depend on each other using arrows to visualize their order of completion.
Determine Task Duration
Let’s be honest; we could better estimate how long things take. I know it is a hard truth to swallow, but admitting we have a problem is the first step!
Ask yourself how often you have told someone, “Yeah, I can get this done in a couple hours,” when it’s a good 5-6 hours. Why do we constantly overestimate our abilities?! Too often, we’re too caught up in looking skilled and impressive instead of being realistic.
When planning projects and building Gantt charts, map out tasks at the micro level. Don’t just list “Write research report” and call it a day. Break it down – outline sections, write section 1 draft, write section 2 draft, edit report, finalize report. Getting into the nitty gritty helps surface hidden tasks that sink timelines when forgotten.
The more accurate you get at breaking down the work, the more likely you’ll be on time and track, making the Gantt chart an even more powerful partner to task management.
Add Milestones
Remember to mark those monumental achievements as you embark on your project journey! Think of them as checkpoints on your roadmap, representing significant milestones in the project. Adding these key points to your timeline creates a definite way to track progress and identify potential delays before they derail your plans.
It’s ok to celebrate these milestones! It boosts team morale, reminds you how far you’ve come, and keeps you motivated to reach the finish line.
Assign Resources
Like any successful team, your project needs the right resources to thrive. How? Assign people, equipment, and other necessary tools to tasks within the Gantt chart. But remember, your resources are limited.
Tracking their availability and team workloads ensures you don’t over allocate and keeps everyone working efficiently within their capacity. This careful management of resources prevents burnout and ensures your project stays on track, fueled by the right tools and talent.
Update the Gantt Chart Regularly
The information you put in the chart needs to be kept up to date; otherwise, if you’re sharing it with stakeholders or others, they could miss relevant information. You also went through all that trouble to break down the project. Checking things off as they are completed is motivating. One step closer.
It’s important to keep the information in the Gantt chart updated. This is especially important if you’re sharing it with stakeholders or others, as outdated information could lead to missing important details. Items can include task estimates, dependencies, and resource allocation.
You put in a lot of effort to break down the project, so it’s a good idea to mark tasks as completed as you go along. This can be a great way to stay motivated and feel like you’re making progress.
Create the Gantt Chart with Leantime
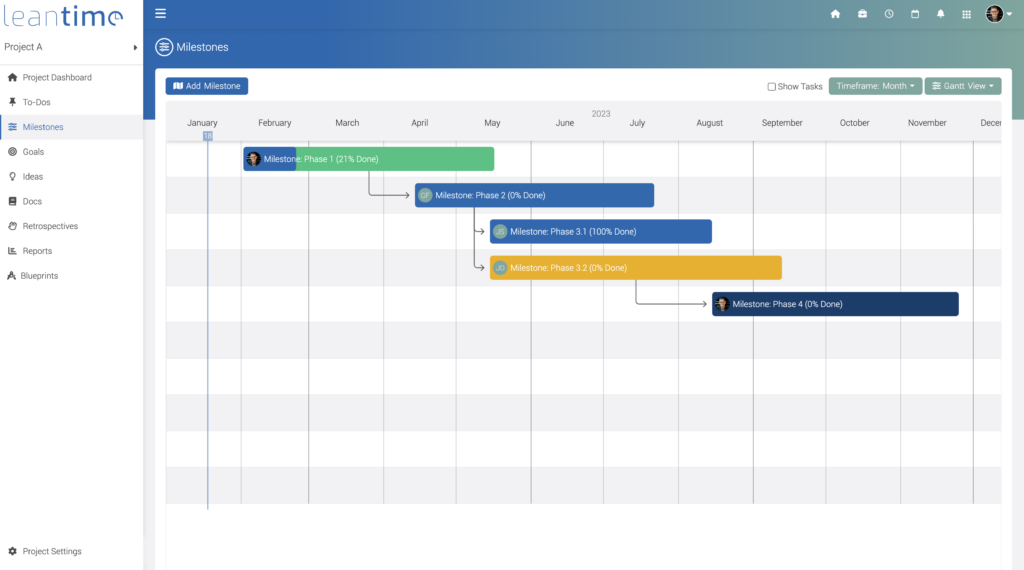
Creating the chart is often easier when you’re using a project management tool. There are many out there, and they can end up overwhelming. Leantime is an open-source project management system that makes getting set up really quick and allows you to track the research and discovery that often goes with your project development.
if you’re looking for a project management tool with Gantt chart functionality, Leantime.io is a good option to consider.
Leaantime Features
- Task Management
- Idea Management
- Goal Tracking
- SWOT Analysis
- Empathy Maps
- Project Briefs
- Time Tracking
- AI Task Prioritization
- Strategy Management
- Program Plan management
- And much more
Leantime: Free Download
Getting the Most Out of Your Gantt Charts
Unlock the full potential of your project management with Gantt charts, powerful tools that offer a visual roadmap to streamline planning and execution. We’ve included tips on maximizing their effectiveness and bringing enhanced clarity and efficiency to your project workflows.
Make it Clear and Simple
Think of high-level details without the information overload.
Use It as a Communication Tool
Share the chart with project stakeholders, including clients, executives, and team members, to keep everyone informed and on the same page.
Use It to Identify and Prevent Potential Problems
Use the chart to identify bottlenecks, risks, and obstacles and make adjustments to the timeline and resources as needed to keep the project on time.
Use It to Track Progress
Don’t just set it and forget it. Use it as a resource to track the progress of each task, making any relevant adjustments needed to ensure that the project stays on track and meets its goals.
Non-Traditional Uses for Gantt Charts

Gantt charts are not only limited to project management but they can also be utilized for various other purposes, including:
Wedding Gantt Chart
Planning the wedding of your dreams just got a whole lot smoother with the help of a Gantt chart. Yes, it’s true! You can ditch the overwhelming to-do lists and scattered spreadsheets and embrace the organized world of your wedding Gantt chart.
Setting clear deadlines for key tasks such as dress fittings, flower delivery, and booking your dream venue is important. Coordinate efforts seamlessly with your wedding planner, caterer, photographer, and other vendors, making sure everyone is on the same page leading up to the big day.
Managing a budget can be stressful; with the help of Gantt charts, allocating your budget wisely across different categories like attire, venue rental, and decorations, staying on top of expenses every step of the way.
And finally, visualize your perfect wedding day come to life. Craft a precise timeline for the ceremony, reception, and any other special events, ensuring each moment unfolds smoothly and flawlessly. With your wedding Gantt chart as your guide, planning your big day goes from stressful to exciting, leaving you free to focus on the true magic of saying, “I do.”
Construction Gantt Chart
Transform your dream home into a reality with ease! Say goodbye to vague plans and embrace the organized world of your home renovation Gantt chart.
This powerful project planning tool lets you break down your task into manageable phases, like demolition, construction, and finishing, assigning precise start date and ending dates for each stage.
No more uncertainties about the arrival of the contractor or delivery of materials – your Gantt chart ensures an efficient renovation process. But it doesn’t stop there! Track necessary permits and approvals, staying ahead of any hurdles or bottlenecks.
And most importantly, keep a watchful eye on your budget, monitoring material costs, labor expenses, and even unforeseen changes. With everything laid out visually and clearly, your home renovation journey becomes more exciting, leaving you free to dream about the finished masterpiece you’re about to create.
Fitness Goals with a Gantt Chart
Ditch the vague workout plans and welcome the organized world of your personal fitness Gantt chart. Set your journey by establishing clear personal milestones, including weight loss targets, improved endurance, or specific training benchmarks.
Push yourself closer to your goals with manageable phases. Seeing your progress visually mapped out can be highly motivating, keeping you focused and on track to achieve your goals. Embrace the structure of your fitness with a Gantt chart, and watch your fitness journey unfold!
Education Gantt Chart
Are you tired of jumbled notes and disorganized to-do lists for your school projects? Whether you a teacher or student, using a Gantt chart to help you visually organize your project? Easily outline your goal and create smaller project tasks, such as literature reviews, data collection and analysis, and assigning deadlines, so you can easily keep track of your progress with a Gantt chart.
By embracing the power of Gantt charts beyond traditional project management, you can gain valuable organizational tools for managing your daily tasks, school projects, volunteer activities, and personal goals, leading to increased productivity and a sense of accomplishment.
Finance Gantt Chart
Are you feeling overwhelmed by your finances? The Gantt chart is a powerful tool that can take your money management to the next level.
Imagine visually mapping out your financial goals, from paying off debt to saving for a dream vacation. Break down those goals into smaller, actionable steps with clear deadlines, making even the most ambitious plans seem manageable.
Track your income and expenses effortlessly, visually seeing where your money goes each month. This newfound awareness empowers you to make informed financial decisions, prioritize spending, and identify areas for improvement.
Whether planning a budget, tackling high-interest debt, or saving for a major purchase, a personal finance Gantt chart becomes your financial compass. It keeps you motivated, accountable, and on track to achieve your financial goals, one step at a time.
Planning a Trip with a Gantt Chart
Organizing your next adventure just got easier! Instead of relying on scattered notes and mental checklists, picture your dream trip mapped out clearly and visually.
With a Gantt chart, you can visualize your itinerary, from travel days and accommodation bookings to exciting activities and local treasures. Break down logistics such as flights, tickets, and even packing into small tasks, guaranteeing everything gets done without a snag.
And to keep everyone on the same page, share your chart with your travel buddies, turning planning into a fun, collaborative experience. So, pack your bags and embrace the journey, all guided by the organization and clarity of your trip-planning Gantt chart!
Highlight Your Work
Gantt charts can be a great way to impress your boss with your project management skills, but be careful not to overdo it. Too many Gantt charts and your boss might just stop looking at them.
Some of these may be a stretch, but I have known folks to use them for closer to everything. Planning a wedding? Absolutely; use a Gantt chart. It’s a valuable visual representation of upcoming work and can help paint a better overview than we might get with a wall of tasks. Managing projects just got easier!
Gantt Chart Alternatives
Although Gantt charts can prove useful for a variety of projects, they may not be the optimal choice for every team. Numerous other project management charts, boards, and tools offer a distinct approach to project visualization and management. Some of the popular alternatives include:
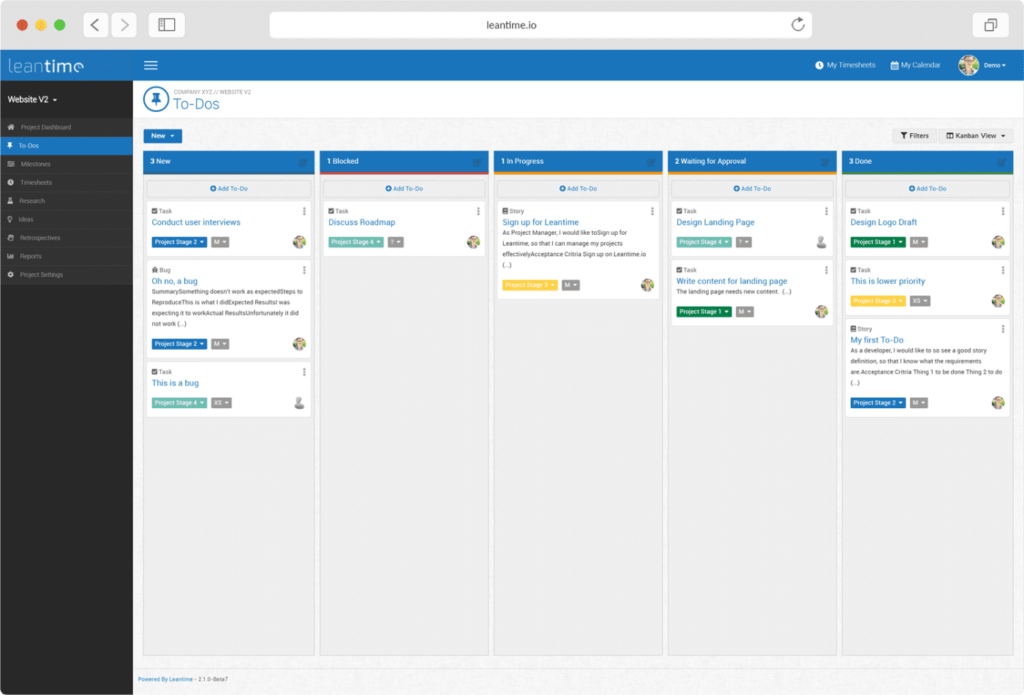
Kanban Board
Kanban boards use cards to represent tasks and columns as workflow stages. Team members move cards between columns as tasks progress, providing a clear overview of status and workflow.
Timeline Charts
Project timeline charts offer a straightforward and linear representation of tasks and events over a specific period. While they are less detailed than Gantt charts, they provide a quick overview of the major project milestones.
Scrum Boards
Scrum boards are used in agile project management to visualize user tasks in a backlog and display their progress through different stages during each sprint.
Project Checklists
Project checklists are easy to use and can be adapted to any team. They can be used alone or with other charts and boards.
Final Thought
The Gantt chart is a powerful tool for creating successful projects. By providing a clear, concise and visual representation of a project’s timeline and progress, the Gantt chart helps project managers plan, monitor, and control the various tasks and activities involved in a project. It also helps communicate and engage statuses with outside stakeholders.
So whether you are managing a construction project, a software development project, or any other type of project or even your grocery list, a basic Gantt chart can help you stay organized and on track.
Other articles you may be interested in: